
Partner Story
Okta Businesses @ Work gets a new dashboard.
The challenge
Focused data marketing
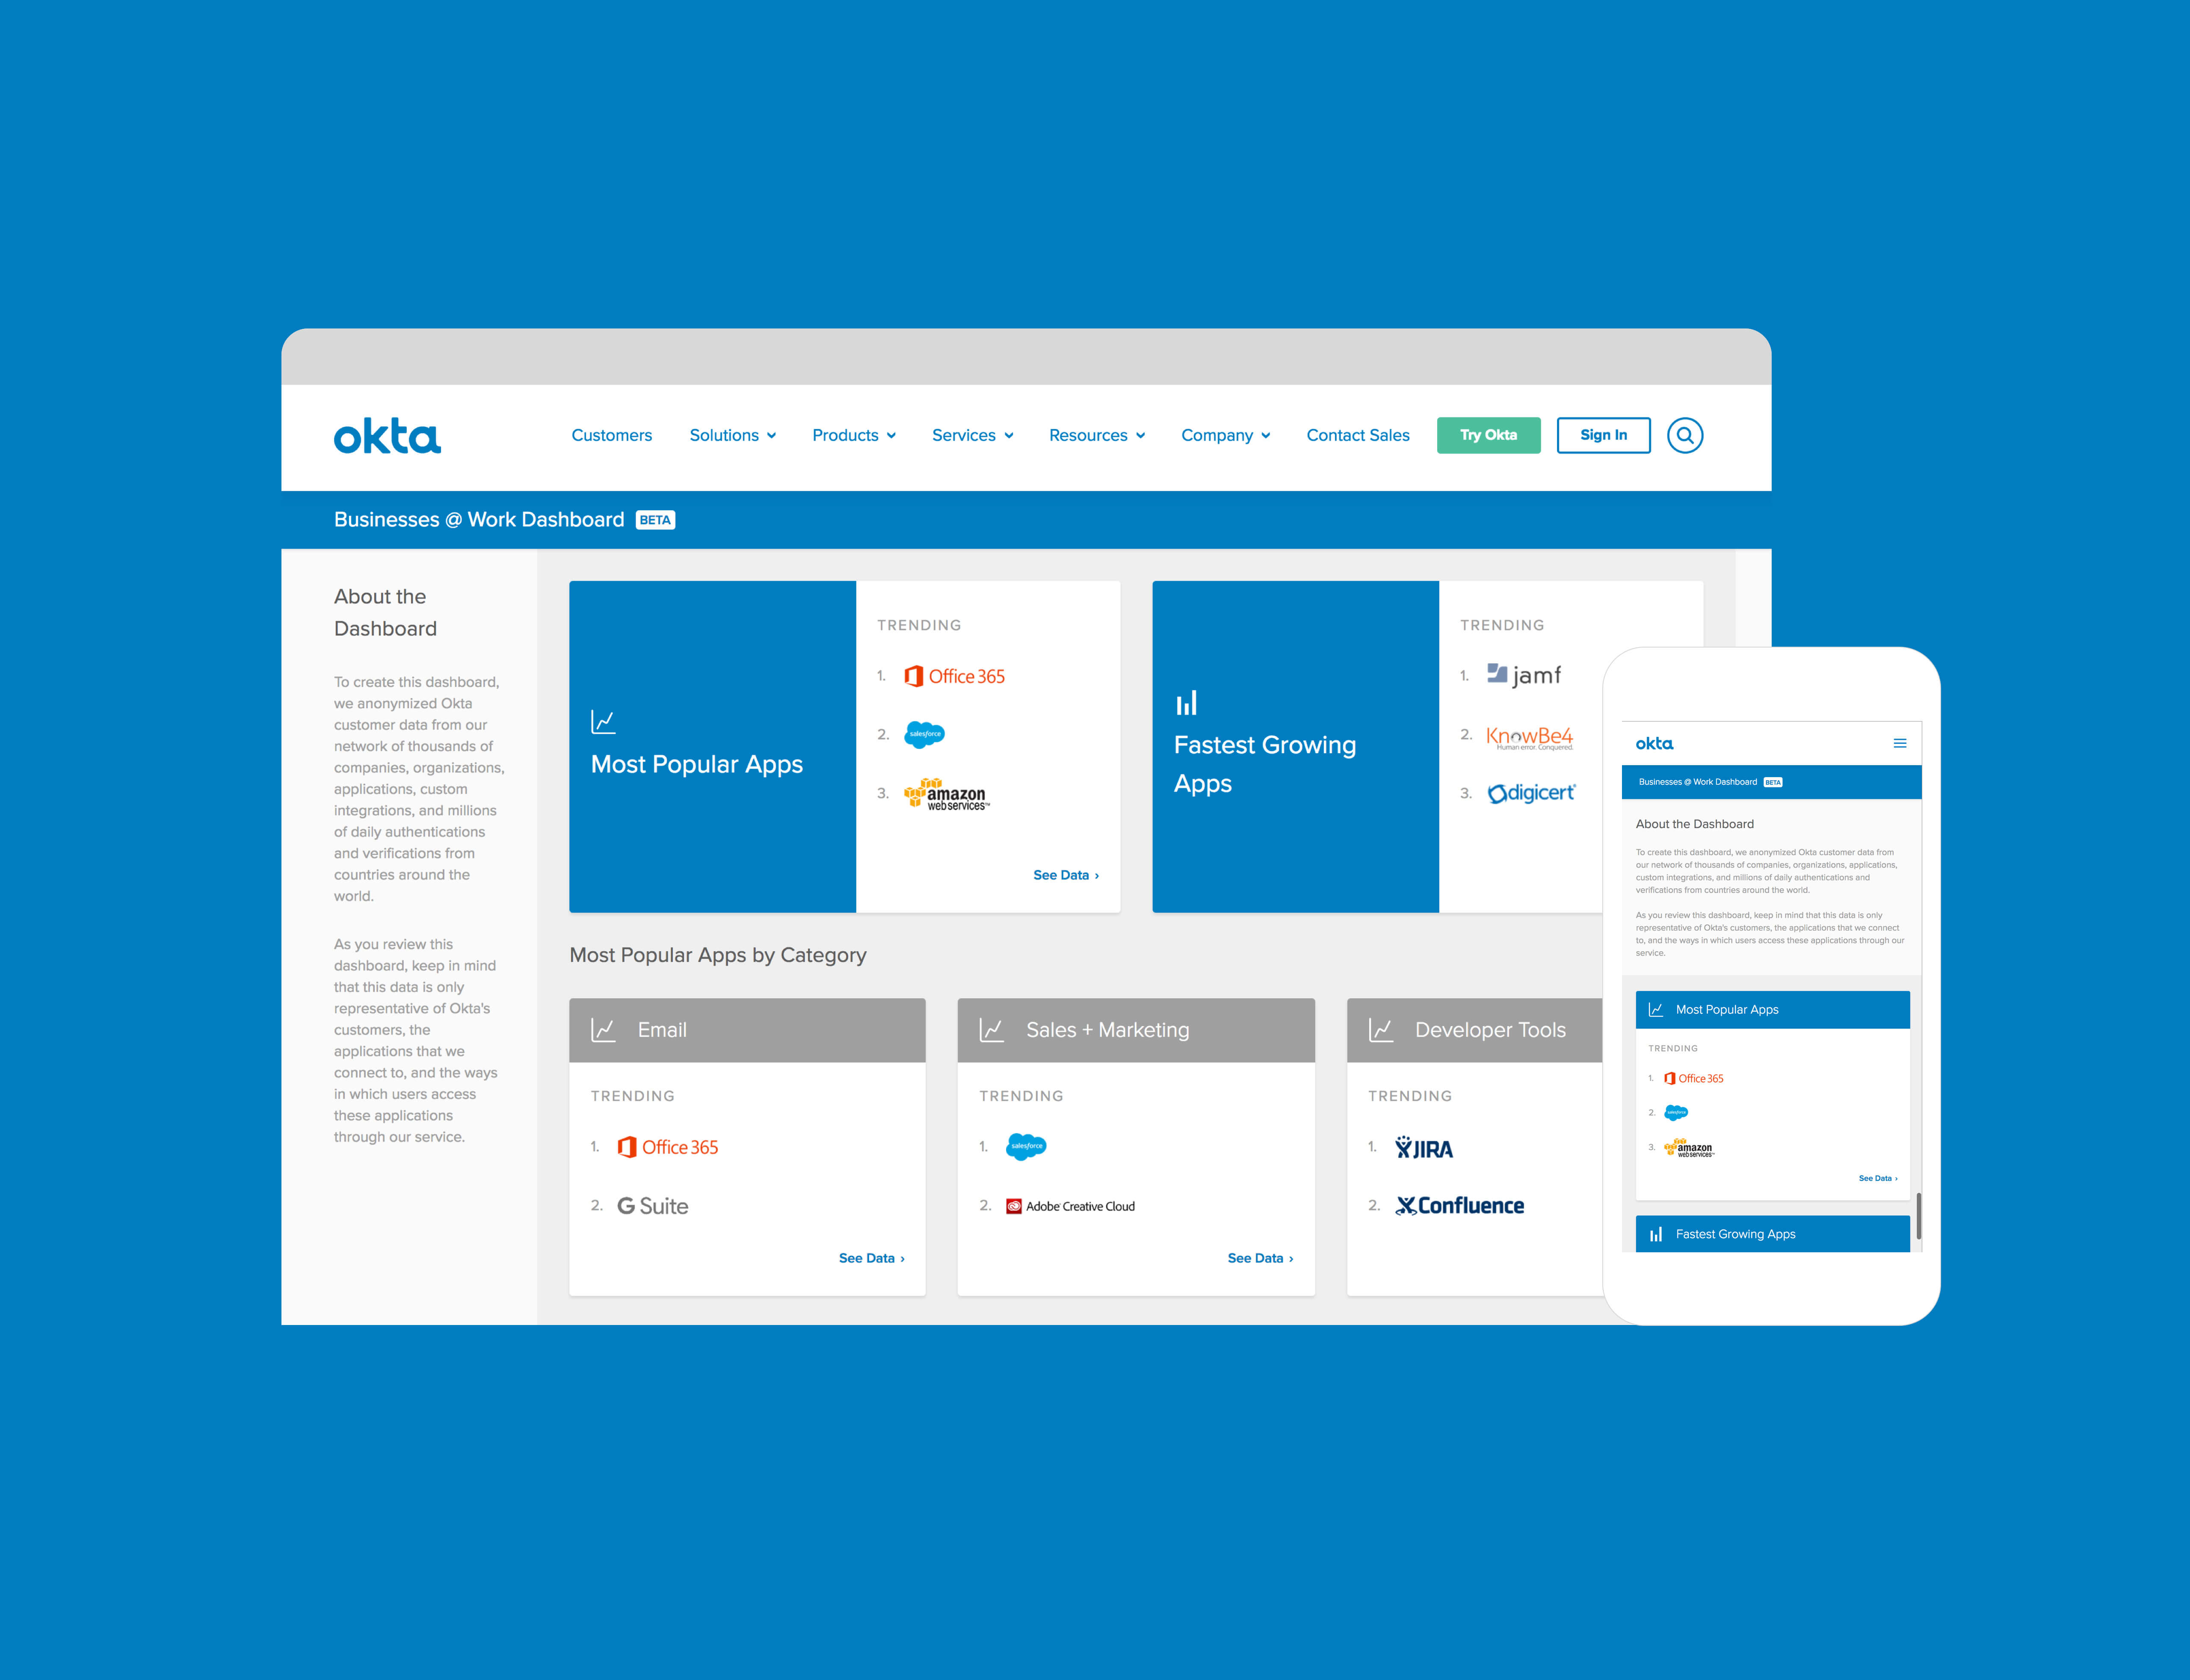
Okta wanted to convert its static annual Businesses at Work report into a real-time visualization to help decision makers better understand trending apps within specific industries. They settled on an interactive dashboard that could keep pace with the rapidly changing landscape of app popularity.
Okta had the data, but it was unmanageably large (over 5000 apps used by more than 3000 customers). Okta knew that if they could find a way break out this data into meaningful visualizations, the result could be an amazing new tool for their existing customers and prospects.
The process
Dynamic data visualization
Flexibility was a key requirement and the dashboard view allows Okta to add any number of charts and order them as they need.
The dynamically created tiles in the dashboard automatically display the the top performers (label and logo) in that category.
The payoff
Easy to use insight
Flickerbox built a Drupal-based workflow which parses an enormous data file which empowered the web marketing team to dynamically create any number of filterable charts from their dataset and use them within the dashboard or anywhere on the site.

Bonus round
…Twice you’re good
And in 2020 we did it all again as part of Okta’s migration from Drupal 7 to Drupal 8.